|
Legend:
|
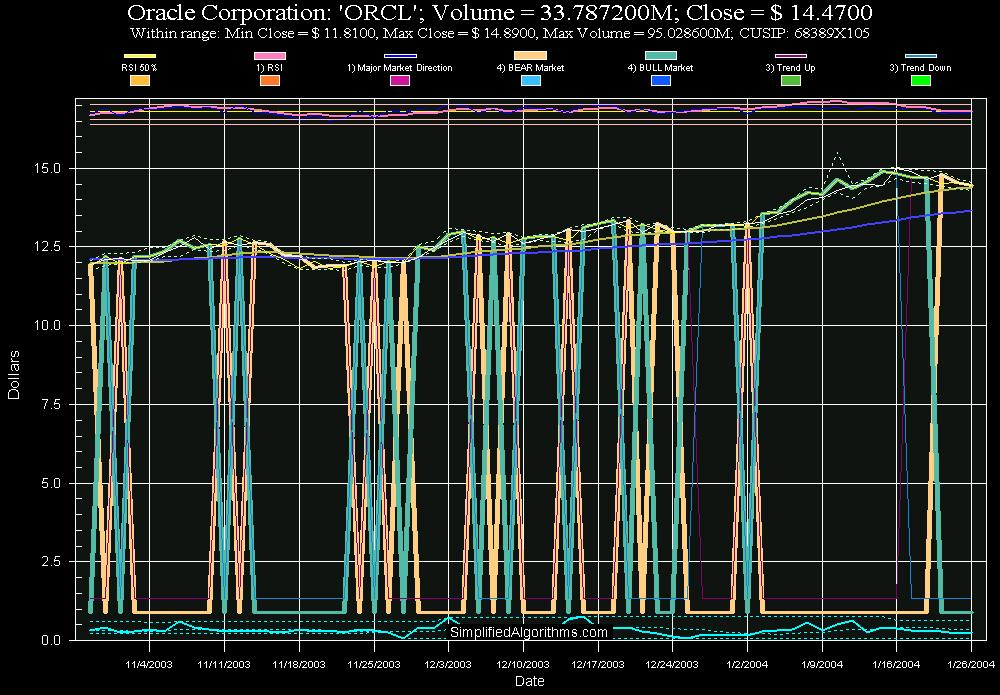
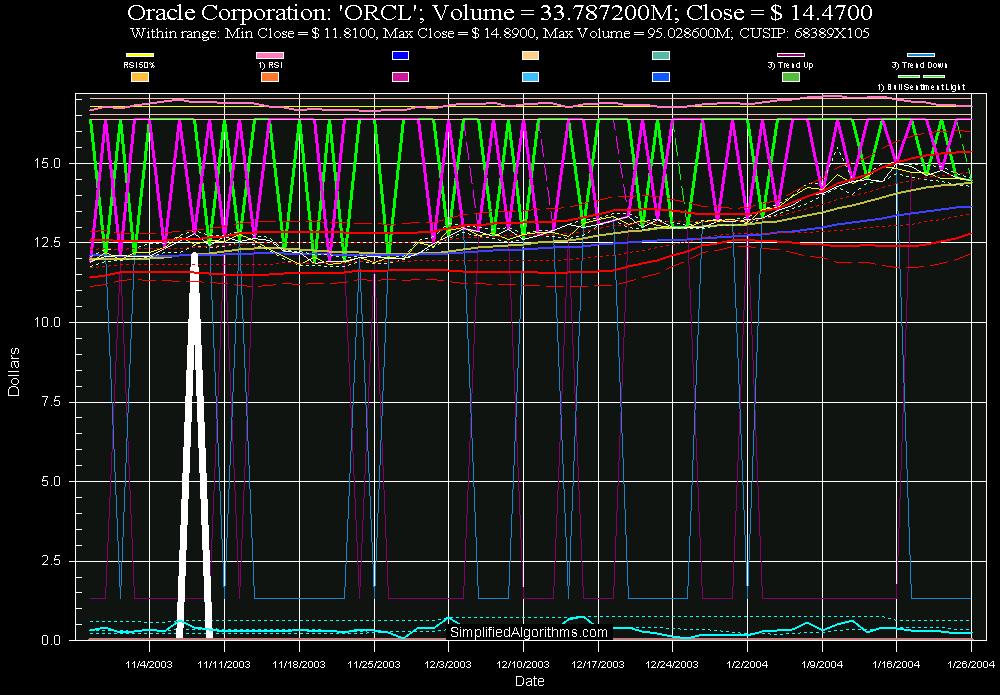
My program also generates
this same chart (and progressive regression charts) for any stock (see
below). There are many other
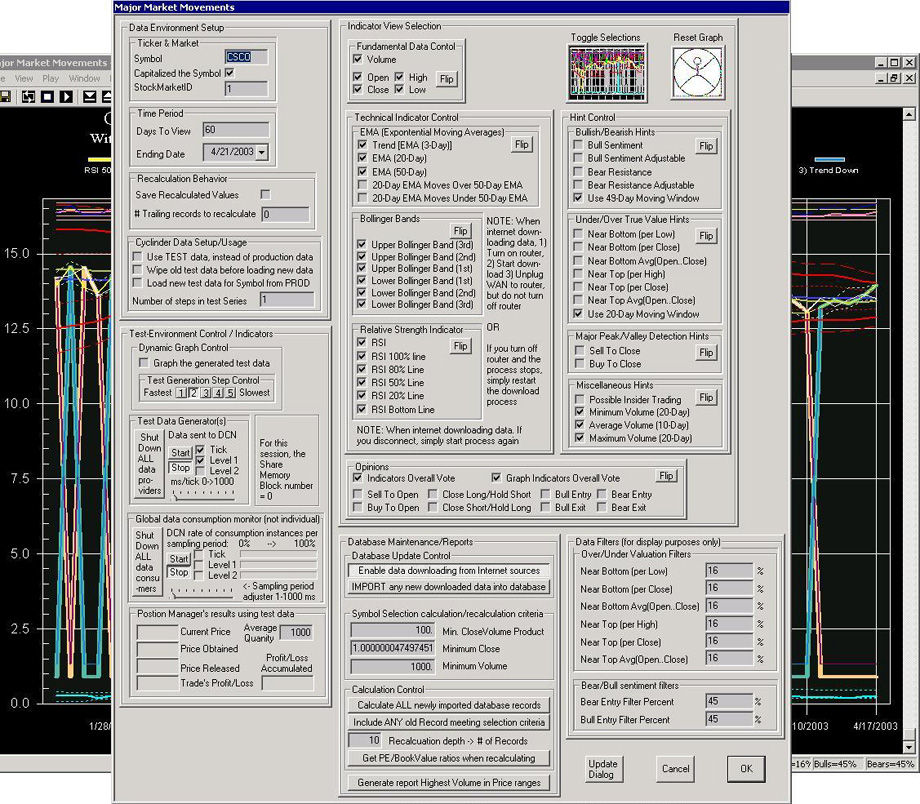
technical indicators not shown, among these are the AI generated hints,
opinions and (in the automated trading system) recommendations. Additionally,
I implemented multi-threading for the “test environment control” to
efficiently generate test data (derived from actual data), which then sends
this data to the shared memory controller (DCN.DLL), for the testing of the
back-end automated trading system (i.e.: a complete test bed environment
for the back-end process which is also multi-threaded). Note: not all indicators that could be
shown are shown (see graph below for some additional indicators that may be
user selected via the graphical
user interface (GUI)).
Indicator description: Location of
demonstrated usage:
|
|
Light Blue (Heavy Line)
|
Bull (rising) market
|
Top graph
|
|
Light Orange (Heavy Line)
|
Bear (falling) market
|
Top graph
|
|
Dark Purple (Thin Line)
|
Preemptive downward trend
|
Top graph
|
|
Dark Blue (Thin Line)
|
Preemptive upward trend
|
Top graph
|
|
Purple
(vertical riser)
|
Buy Long / Cover Short
|
Bottom graph
|
|
Brown
(vertical riser)
|
Sell Short / Exit Long
|
Bottom graph
|
|
Orange
(vertical riser)
|
Major Bottom
|
Bottom graph
|
|
Light Blue
(vertical riser)
|
Major Top
|
Bottom graph
|
|
Red (near top - horizontally flowing)
|
Bollinger Bands
|
Bottom graph
|
|
White
(near top - horizontally flowing)
|
Opening price
|
Top and bottom graphs
|
|
Light Yellow
(near top - horizontally flowing)
|
Closing price
|
Top and bottom graphs
|
|
Dark Blue
(near top - horizontally flowing)
|
50-day exponential moving average
|
Bottom graph only
|
|
Dark Yellow
(near top - horizontally flowing)
|
20-day exponential moving average
|
Bottom graph only
|
|
Top Pink (top
- horizontally flowing)
|
RSI
|
Bottom graph only
|
|
Light Blue
(bottom - horizontally flowing)
|
Volume with running 20-day maximum, minimum and average
indicators
|
Bottom graph only
|